In 2024, vegetable oils accounted for 23% of Ukraine’s exports
Category:
![]() News
News
Export Destinations:
- Europe including the EU – 60.9%
- Middle East – 15.0%
- Southeast Asia – 14.8%
- Africa – 4.8%
- Asia (other countries) – 3.1%
- Americas – 1.4%
Export Structure by Product:
- Sunflower oil – 89.0%
- Soybean oil – 5.5%
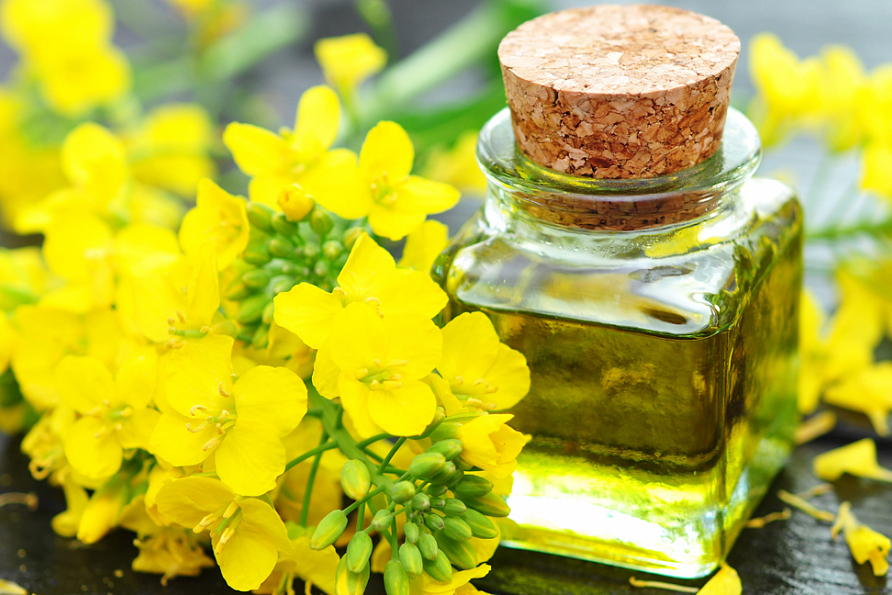
- Rapeseed oil – 4.2%
- Other – 1.3%
Key Insights:
- Dominance of a single product: sunflower oil makes up the lion’s share (89%) of this category, reinforcing Ukraine’s status as a key global player in this market. At the same time, the share of soybean and rapeseed oils is also gradually increasing.
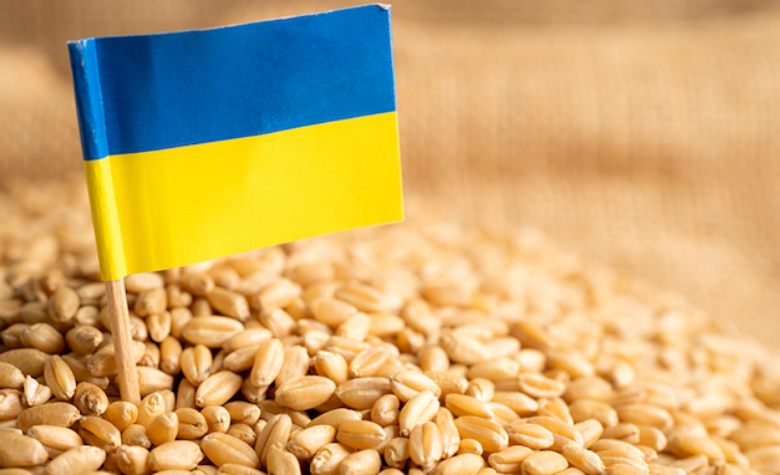
- Stability despite the war: after the record-high revenue of $7.04 billion from oil exports in 2021, export earnings have consistently exceeded $5.6 billion each year even under full-scale war conditions. The 2024 figure ($5.76 billion) confirmed that this sector not only withstood the shock but also successfully adapted to new realities, remaining a reliable pillar of the economy.
- Wide distribution geography: unlike raw commodities, vegetable oils as processed products have a more diversified sales geography. While Europe remains the leader, the combined share of Asian and Middle Eastern countries exceeds 30%, indicating strong demand for Ukrainian oil in distant markets. This also reflects global need for Ukrainian oils and improvements in export logistics, as well as a broader importer base – 139 countries in 2024 (compared to 133 in 2023).
Conclusion: Vegetable oils remain a significant driver of Ukraine’s foreign trade among value-added products. One of the critical factors for exports continues to be the availability of logistical routes. In 2024, the deep-sea ports of the Black Sea regained their dominant role, providing nearly half of all exports (compared to less than 15% in 2023). However, alternative export channels – Danube ports and the Solidarity Lanes – continue to play a substantial role, ensuring over 45% of shipments.
Learn more in the full Export Portfolio 2025: https://cutt.ly/rr1U8YTa